Pisano et al. viral tracing injection sites
This page contains links to interactive visualizations of the volumetric cerebellar injection sites described in the manuscript: “Homologous organization of cerebellar pathways to sensory, motor, and associative forebrain” by Thomas J Pisano et al.: https://www.sciencedirect.com/science/article/pii/S2211124721011700
Injection sites were identified in transsynaptic tracing studies by co-injecting CTB with virus. Post-registered light-sheet volumes of the injection channel were segmented to obtain voxel-by-voxel injection-site reconstructions. Volumes were Gaussian blurred (3 voxels). All voxels below 3 standard deviations above the mean were removed. The single largest connected component was considered the injection site (scipy.ndimage.label, SciPy 1.1.0, Virtanen et al., 2020). Spurious pixels of the injection site segmentation outside of the Princeton Mouse Atlas boundaries are associated with minor registration imprecision, minor damage of cerebellar cortex from brain extraction or excitation of the CTB fluorophore that is above or below. CTB was selected for injection site labeling for transsynaptic tracing as it does not affect the spread of alpha-herpesviruses and its greater diffusion due to its smaller size overestimates the viral injection size by as much as two-fold (Aston-Jones and Card, 2000; Chen et al., 1999). Although typically used as a retrograde tracer itself, used during the small window of ~80 hours post-injection, it did not have time to spread significantly.
Neuroglancer how-to
The visualizations at the following links use the web application Neuroglancer for displaying and interacting with the data. Neuroglancer displays datasets in “layers”, each being represented by a text box near the top of the screen. Each layer consists of segments which can be individually highlighted, selected or de-selected. Below is a screenshot of how the window will appear when the first heatmap link below is clicked.
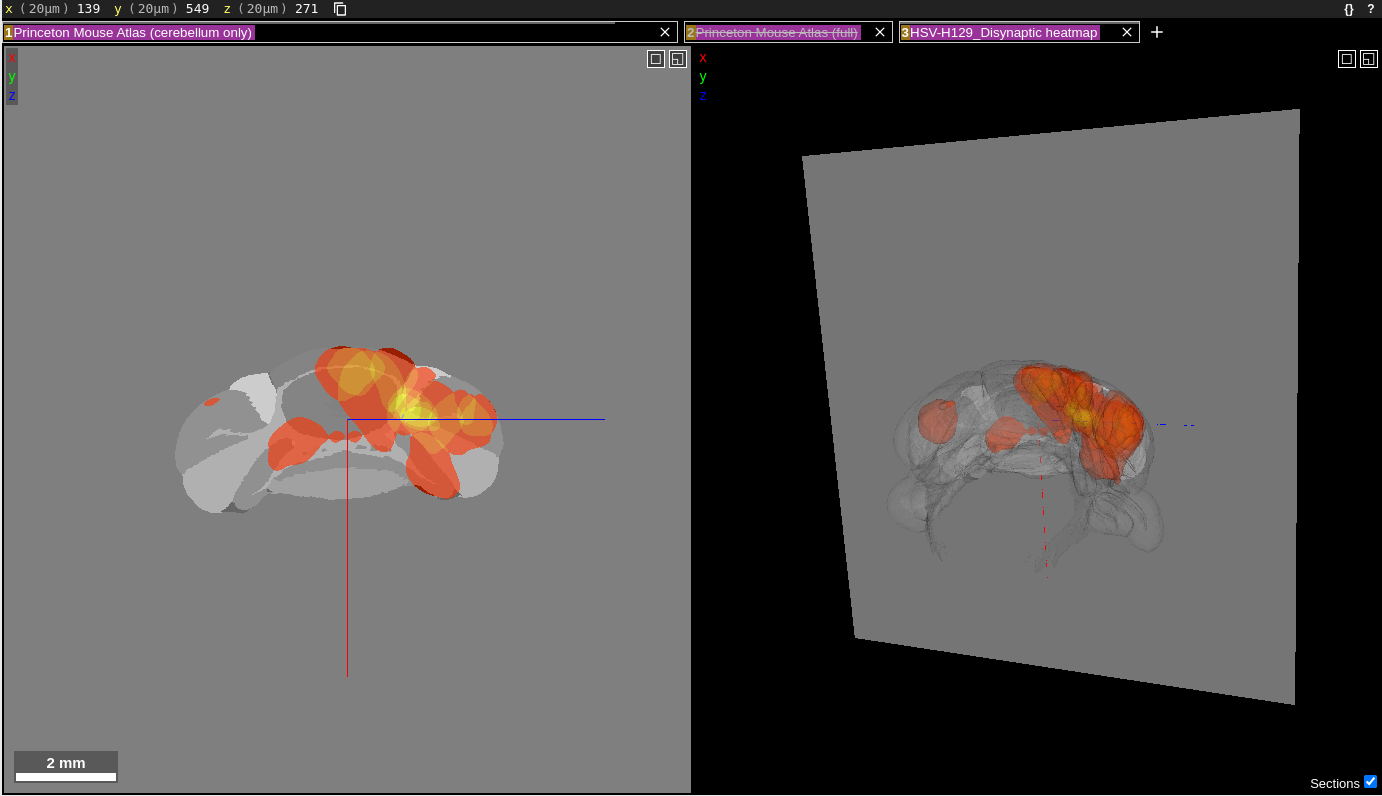
The “Princeton Mouse Atlas (cerebellum only)” is the first layer in the layer list. This layer shows the individual regions comprising the cerebellum in grayscale. The second layer in the layer list is the “Princeton Mouse Atlas (full)”, which is disabled, as indicated by the strikethrough text in that layer box. When enabled, this layer shows the individual regions of the entire Princeton Mouse Atlas. The third and final layer is the heatmap of injections for the HSV-H129 Disynaptic timepoint. Layers can be toggled on/off by clicking anywhere in the corresponding text box for that layer. Once disabled, the layer text will contain a strike through its name. Clicking the “x” in a layer box will remove that layer from the visualization.
The data are displayed in a 2D coronal view (left panel) and a 3D view (right panel). The two panels are synced together; the gray plane in the 3D view corresponds to the section shown in the 2D view. There is also an x,y,z coordinate axis (blue, red, green lines) that indicates the center of both views. It can be used to determine the relative orientation between the two views.
Some basic commands for exploring the data are as follows:
- h key: open help menu
- (2D view) left-click and drag: translate section
- (2D and 3D view) mouse-wheel: scroll along anterior-posterior (AP) axis.
- (2D and 3D view) shift+mouse-wheel: scroll (x10 speed) along anterior-posterior (AP) axis.
- (2D and 3D view) ctrl+mouse-wheel or ctrl+”+/-“: zoom in and out
- (2D and 3D view) double left-click: select/de-select segment
- (2D and 3D view) Hover over a segment: highlights the region and displays the brain region name in the atlas layer box area.
- (3D view) left-click and drag: rotate brain
- (3D view) s key: toggle the gray reference slice on/off
- right click on layer box: open up options for displaying that layer such as opacity, color scheme, segment selection
Finally, the neuroglancer URL is updated in real time each time you make a change to the viewer. If you reach a state that you want to save and share, simply copy the neuroglancer URL from your browser. If you want to restore to the original state, come back to this page and click the link again.
Injection site heatmaps
The following three links display synced 2D and 3D heatmaps overlaid on the Princeton Mouse Atlas. Each link shows the heatmap at a different timepoint. The color of the heatmap indicates the number of brains injected at that location. When hovering over a region of the heatmap, the number of brains injected at that location is displayed in the heatmap layer box, which is the last in the layer list at the top of the screen.
HSV-H129 Disynaptic timepoint (heatmap) an012 HSV-H129 Trisynaptic timepoint (heatmap) an012 PRV Disynaptic timepoint (heatmap) an012Injection volumes separated by primary injection site
The links below show the volumetric injection sites for individual brains, organized by primary injection site. We categorized the primary injection sites into seven distinct brain areas in the cerebellum:
- Paramedian lobule, Copula Pyramidis
- Lobule I-V
- Lobule VI, VII
- Lobule VIII-X
- Crus I
- Crus II
- Simplex
For each primary injection site heading below, there are links for each of the three timepoints. When the links are first loaded, the injection sites from all brains having the given primary injection site at the given timepoint are displayed in the same color on top of the Princeton Mouse Atlas. The layer box at the top with “pooled_by” in the name contains this data.
The remaining layers consist of the layer boxes with names “… 01”, “… 02”, and so on. These layers show the injection sites for the individual brains in different colors. These layers are all disabled by default.
Paramedian lobule (PM), Copula Pyramidis (CP) injections
HSV-H129 Disynaptic (PM, CP) an012 HSV-H129 Trisynaptic (PM, CP) an012 PRV Disynaptic (PM, CP) an012Lobule I-V Injections
HSV-H129 Disynaptic (Lob. I-V) an012 HSV-H129 Trisynaptic (Lob. I-V) an012 PRV Disynaptic (Lob. I-V) an012Lobule VI, VII injections
HSV-H129 Disynaptic (Lob. VI, VII)HSV-H129 Trisynaptic (Lob. VI, VII)
PRV Disynaptic (Lob. VI, VII)
Lobule VIII-X injections
HSV-H129 Disynaptic (Lob. VIII-X) an012 HSV-H129 Trisynaptic (Lob. VIII-X) an012 PRV Disynaptic (Lob. VIII-X)Crus I injections
HSV-H129 Disynaptic (Crus I)HSV-H129 Trisynaptic (Crus I)
There were no injections for the PRV Disynaptic timepoint in Crus I
Crus II injections
HSV-H129 Disynaptic (Crus II)HSV-H129 Trisynaptic (Crus II)
PRV Disynaptic (Crus II) an012
Simplex injections
HSV-H129 Disynaptic (Simplex) an012 HSV-H129 Trisynaptic (Simplex) an012 PRV Disynaptic (Simplex)Jupyter notebooks to reproduce or customize these Neuroglancer visualizations can be found here: https://github.com/PrincetonUniversity/lightsheet_helper_scripts/tree/master/projects/tracing/injection_site_neuroglancer_post/notebooks