Displaying atlas region boundaries in Neuroglancer
We recently added the three dimensional atlas developed by Chon et al. 2019 (PI Yongsoo Kim; Penn State; https://www.nature.com/articles/s41467-019-13057-w) as an option to which we can register your mouse brain light sheet images using our automatic brain registration pipeline, BrainPipe. This atlas merges the widely adopted Franklin-Paxinos (FP) labels into the Allen Institute’s common coordinate framework (CCF). By aligning your data to this atlas, you can overlay the FP boundaries on your light sheet data as shown below. This atlas is only suitable for coronal slice viewing (the resolution is poor in the horizontal and sagittal views). The atlas consists of 123 coronal slices (100 micron spacing), with a spatial resolution of 10×10 microns in each coronal plane.
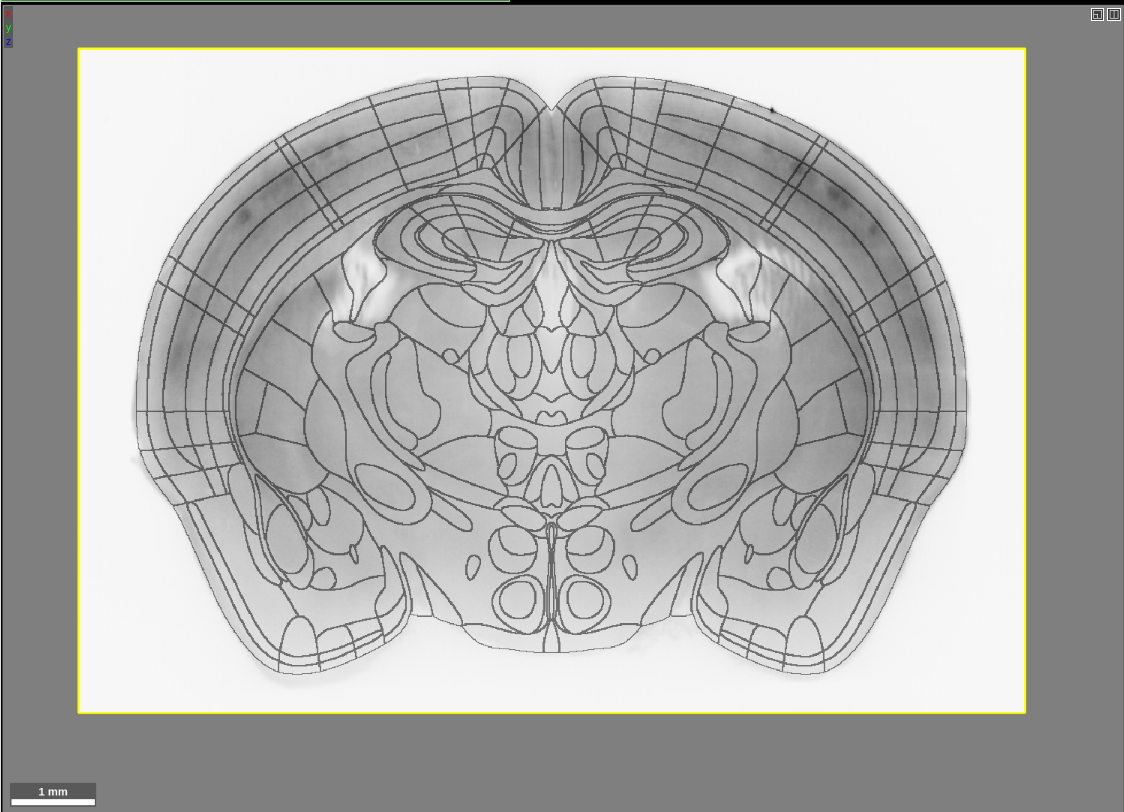
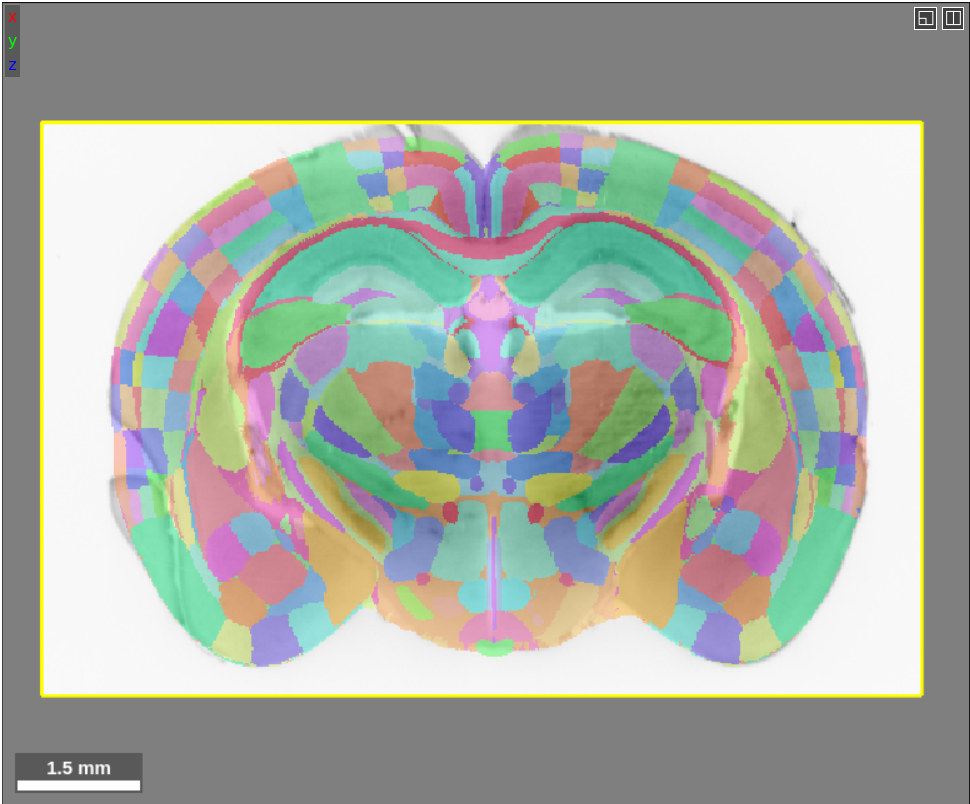
If you are used to viewing our previous atlases in Neuroglancer, you will notice that this looks a bit different. In the past, we have visualized atlases using the “filled” multi-color format:
Showing the boundaries of regions is possible for all of the brain atlases, not just the FP atlas. We store the boundaries in a separate segmentation layer, so in order to see the boundaries this layer needs to be loaded just like an ordinary atlas layer. The Allen, Princeton and FP atlas boundary segmentation layers are all publicly available on our google cloud bucket: gs://wanglab-pma. To load the FP boundary layer into Neuroglancer, for example, type this into the source box:
precomputed://gs://wanglab-pma/kimatlas_boundaries/
If you only load in the segment boundary layer for an atlas, the region name will only appear in the top layer box when you are hovered over the actual boundary. Below is a short video demonstration of what I mean. The region name will appear in the green rectangle (the layer box) near the top of the screen only when the segment is highlighted.
Many people find this inconvenient and prefer for the region name to be displayed if you are hovered anywhere inside of a region. If you are one of these people, a trick is to load the original “filled” atlas layer and then turn the transparency of this layer down, like so:
Like with all segmentation layers, you can select individual segment boundaries either manually by double clicking them, using the search tool described in one of our previous posts, or via the Python API.
As usual, if you have any issues are questions feel free to let us know at ahoag@princeton.edu or lightservhelper@gmail.com.